The waveform display and overview bar help you navigate your project.
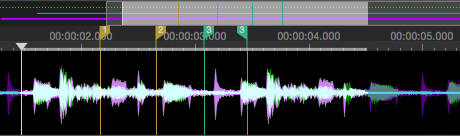
The overview bar is displayed above the waveform and displays a line for each layer's program length.
- Each layer's line color matches the layer's color.
- A solid line represents a layer.
- A bold line represents the selected layer.
- A dimmed line represents a muted layer.
- Markers, regions, and the cursor position are displayed below the overview bar and through the waveform.
- In the sample screen above, the bright rectangle represents a time selection.
The waveform displays a traditional waveform view of each layer.
- Each layer's waveform color matches the layer's color.
- In the sample screen above, the bright waveform represents a time selection.
- Note
- Scroll with your mouse to zoom horizontally, or hold Shift while scrolling to zoom the waveform vertically.
