Table of Contents
Spectral…
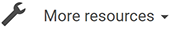
In most audio applications, audio is displayed as a waveform that represents audio in the time domain (amplitude vs. time):
This representation shows the global power of sound; however it doesn’t show what’s inside the sound.
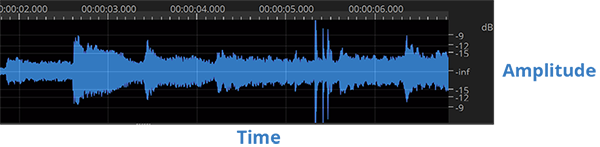
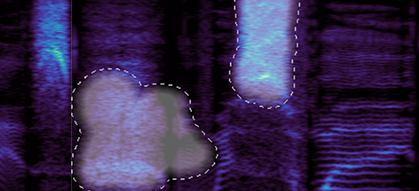
Spectral data represents sound in the frequency domain. You can think of it like a musical score: the higher the peaks in the spectrogram, the higher the tones; the stronger the peaks, the stronger the tones. Everything can be analyzed with this representation: music, voice, even noise.
Spectral analysis uses discrete FFT analysis: you have to choose between time and frequency accuracy. A FFT Size of 2048 or 4096 is usually good for most situations (with a file sampled at 44,100 Hz or 48,000 Hz). Feel free to change the size on the fly as the accuracy of your work highly depends on it (see The Importance of FFT Size).
You should also play with the amplitude settings to see the small peak details in the spectral view.
…Layers
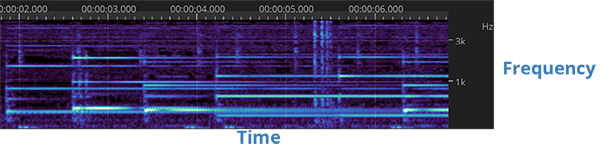
The layer system, similar to tracks in a DAW, allows you to refine your work extensively in a nondestructive way, thanks to transfer operations and the additive and subtractive nature of layer mixing.
If you cut and paste data from one layer to a different layer, you transfer data nondestructively: the sum of the two layers is identical to the source data, but you have full control over the state of the data you extracted to that new layer.
If you copy and paste data from one layer to a different layer, and then invert the phase of that new layer, you subtract the layers nondestructively: the first layer still contain all the original data, and the new, inverted layer acts to subtract the original data. When this negative layer is muted, you get your original data back.
Processes and Tools
Processes work the same way they do in most audio applications: you select an area, and the process is applied to the whole area.
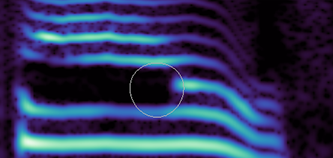
However the difference is that in SpectraLayers One you can select not only time but also frequency areas, so the process is only applied to a certain range of frequencies.
The processes are also different by nature, because they are designed to use spectral data instead of raw audio data, so the purpose and range is not the same as usual audio processes. You can think of them as photo filters.
Tools work the same way they do in paint applications: they are local to the mouse position and allow you to work on specific frequencies.
- Transform tools allows the user to shift layers and selections in time or to rescale (pitch-shift, time-stretch) them.
- Selection tools allow the user to select spectral data.
- Modification tools allow the user to retouch spectral data.
- Drawing tools generate spectral data from scratch.
- Measure tools give the user specific information about spectral data.
- Navigation tools allows the user to navigate the spectrogram.
