
The Waveform Display shows the amplitude of the layers in your project. You can’t directly act on it, except for moving individual wave samples. It is more used as a visualization and navigation display.
At the right of the waveform display is the amplitude scale. Use it to zoom vertically, either by using the mouse wheel or the scroll bar on the right side.
The top of the amplitude scale displays the current power unit. See how to Define Units and Scales.
At the center, the initial of the corresponding channel (for instance C for Center, L for Left, etc…). Click that initial to solo the channel. See also the Channels Panel.
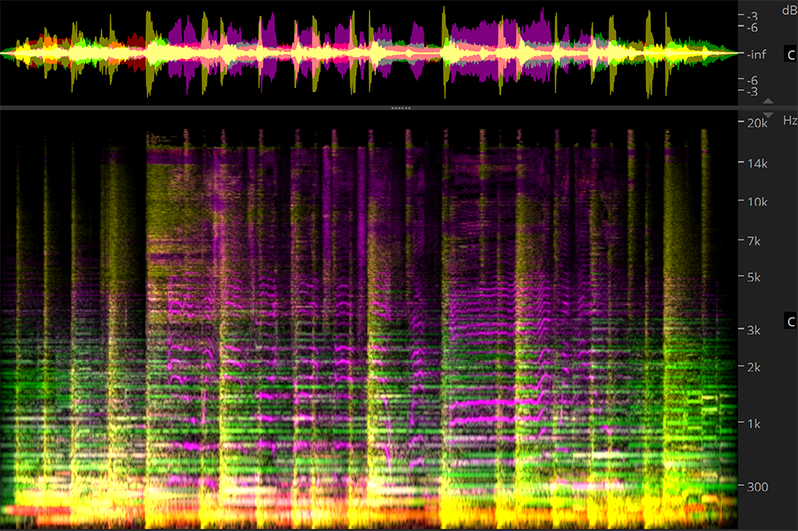
The Spectral Display lets you visualize and edit the spectrogram of the layers in your project. Any tool, selection, measurement, process is applied on this display.
At the right of the spectral display is the frequency scale. Use it to pan or zoom vertically, either by dragging it, using the mouse wheel, or the scroll bar on the right side. See the Navigation Tools.
The top of the frequency scale displays the current frequency unit. See how to Define Units and Scales.
At the center, the initial of the corresponding channel (for instance C for Center, L for Left, etc…). Click that initial to solo the channel. See also the Channels Panel.
At the bottom of the frequency scale you’ll find the current scale. See how to Define Units and Scales.
